Work area(s)
I. Introduction
In 2021, the prices of the main export commodities of Latin America and the Caribbean increased, mainly due to the recovery in global demand —particularly from China— for minerals, metals, fossil fuels and agricultural products, following the impact of the COVID-19 pandemic. In the first months of 2022, those upward trends, especially in hydrocarbon prices, have been strengthened by the conflict between the Russian Federation and Ukraine. However, the prices for each major commodity group (minerals, hydrocarbons, agricultural commodities) have performed differently. Similarly, there is heterogeneity in the behaviour of prices within each group, partly in response to factors specific to each product.
The increase in prices of minerals and metals was also due to the recovery of investment in construction and growth in demand for durable goods, such as automobiles, household appliances, and equipment and machinery. Energy transition is also expected to push up demand in the medium and long term for the metals needed for the production of electric vehicles, infrastructure and green technologies. This will increase the profitability of mining projects and attract new investments to the sector, which, on the other hand, could intensify the adverse impacts on economic, environmental and social considerations. Mining production and consumption activities should, therefore, be decoupled from those negative impacts, and the higher revenues exploited to finance the change in the production structure, within the framework of the 2030 Agenda, avoiding a potential delay in the energy transition due to the increase in the prices of the minerals required for it.
Although hydrocarbon prices have risen rapidly since the second half of 2021, on the back of the swift recovery in global economic activity and geopolitical factors, their movements are framed in a context of great uncertainty, deepened in the medium and long term by the trend of global agendas towards the development of cleaner energy systems. Thus, hydrocarbon markets will depend to a large extent on the degree of progress in the energy transition to cleaner and renewable energy sources.
The big drop in commodity prices in 2020 was not felt in agricultural commodities, demand for which persisted in spite of the pandemic. In fact, the price of agricultural products reached a ten-year high in February 2022. This greatly benefited producing countries while hurting importers. The combination of high international prices and declining incomes is affecting consumers' purchasing power through domestic inflationary processes, particularly in the most vulnerable households.
What follows is a more detailed sectoral analysis of movements in the international prices of minerals, hydrocarbons and agricultural products.
II. Sectorial analysis
A. Upward trend in non-renewable natural resource prices
The international prices of non-renewable natural resources rose significantly in 2021 and contributed to the economic recovery in the region, particularly in hydrocarbon and metallic-mineral-exporting countries. However, as the brief analysis below shows, there are price behaviour differences between hydrocarbons and minerals, as well as within both those categories.
1. Higher mineral prices and expectation of increased demand due to energy transition
In 2021, prices of minerals and metals rose by 44.8% over 2020 (see figure 1). Despite falling in the first months of 2020, due to the COVID-19 pandemic, in 2021, copper, tin, iron and gold prices achieved peak values, surpassing those seen in 2011 during the last “supercycle” in mineral prices. Between 2020 and 2021, aluminium, copper, tin and iron prices grew by 42.8%, 48.5%, 86.1% and 46.1%, respectively (see table 1). An exception was the price of gold, which had stagnant growth of 0.06% during the same period, although its demand and price did not fall during the pandemic, due to its attractiveness as a valuable and liquid asset.
Figure 1
Changes in price indices for minerals and metals, 2000–2021
(Index: 2010 =100, based on real prices at 2010 dollars)
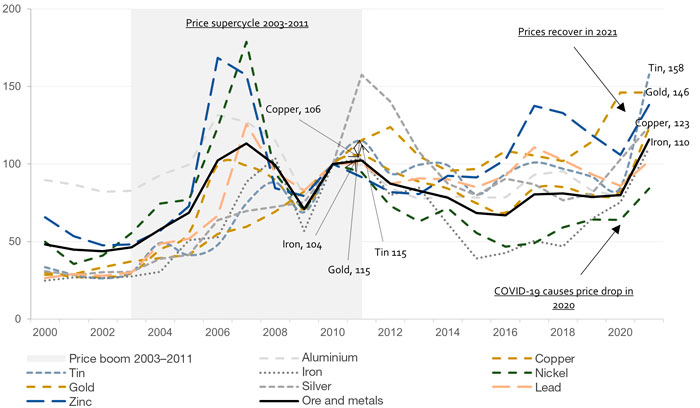
Source: Economic Commission for Latin America and the Caribbean (ECLAC), on the basis of World Bank, “World Bank Commodities Price Data (The Pink Sheet)” [online] https://www.worldbank.org/en/research/commodity-markets.
Table 1
Prices of fossil fuels, minerals and metals, various years
(Dollars at real 2010 prices)
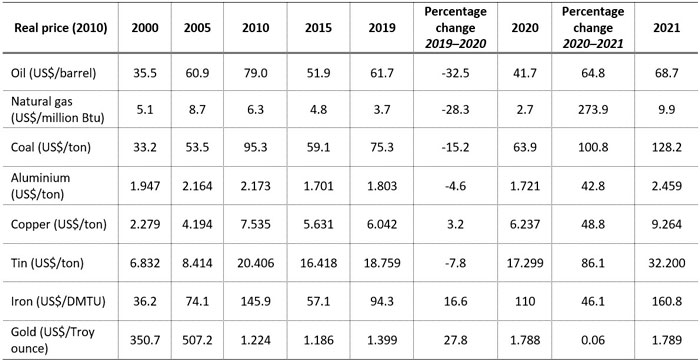
Source: Economic Commission for Latin America and the Caribbean (ECLAC), on the basis of World Bank, “World Bank Commodities Price Data (The Pink Sheet)” [online] https://www.worldbank.org/en/research/commodity-markets.
Notes: Btu = British thermal unit. DMTU = dry ton
The increase in prices was due to the recovery in global economic activity; increased demand, mainly from China, the world's largest consumer of metals; and supply chain disruptions (ECLAC, 2021). Investment in infrastructure and construction, as well as growth in demand for automobiles, household appliances and machinery, have been factors driving demand for metals (World Bank, 2021b).
The short-term outlook for mining is positive due to the resurgence of global demand. However, there is uncertainty regarding the outlook for the pandemic, supply disruptions and inadequacy and withdrawal of economic and domestic demand stimulus measures deployed during the crisis. Failure to achieve consistency between monetary and fiscal policies could lead to greater uncertainty. Added to this are the effects of the conflict between the Russian Federation and Ukraine on the prices of some minerals during the first months of 2022. In particular, the prices of titanium, palladium, neon gas, aluminium and nickel have rebounded sharply in this period, as the two countries in conflict are important global producers of those products. The uses of these minerals include the production of semiconductors, electric batteries and automobiles, so the advance of electromobility could be slowed both by rising prices and disruptions in global supply chains.
In the medium and long term, the energy transition is expected to increase demand for most metals, including aluminium and copper (electric vehicles and infrastructure), nickel, cobalt and lithium (batteries) and rare earth metals (magnets for green technologies). According to World Bank estimates (Chian and Baffes, 2021), electric vehicles require four times more copper than conventional cars. According to the IEA broad scenario (2021), lithium and cobalt consumption would have to increase more than sixfold to meet the needs of batteries and other clean energy uses, while copper use would have to double and nickel use quadruple. ECLAC estimates (Jones and others, 2021) project annual growth in refined copper and lithium demand of 1.5% and 16.4%, respectively, from 2019 to 2030. However, the IMF warns that the energy transition could be delayed by rising mineral prices (Boer and others, 2021).
This new scenario of higher prices would mean an increase in the profitability of mining projects, which would attract new investments to the sector, so it is necessary to decouple mining production and consumption from negative economic, environmental and social impacts. In addition, higher prices would allow governments to obtain greater economic income and tax revenues, which, within the framework of sustainable development, should be used both for proper macroeconomic management and to finance changes in the production structure. All of this requires better, multilevel, transparent, democratic, effective and territorially focused governance.
2. Rapid increase in hydrocarbon prices in a context of high uncertainty
Hydrocarbon prices have seen a rapid increase since the second half of 2021 as a result of a swift recovery in global economic activity, prospects of a long, cold winter in the northern hemisphere, and a lower-than-expected hydrocarbon supply reaction. However, the extent and speed of change in prices for each fossil fuel has differed, with a greater rebound in the cases of coal and gas than oil as of the end of 2021 (see figure 2 and table 1). Recently, however, owing to the market uncertainty it has caused, the conflict between the Russian Federation and Ukraine has led to a new price jump, causing the upward trend observed from the second half of 2021, which seemed to stabilise in the last few months of the year, to continue in January and February 2022.
Figure 2
Changes in fossil fuel price indices, 2000–2021
(Index: 2010 =100, based on real dollar prices at 2010 values)
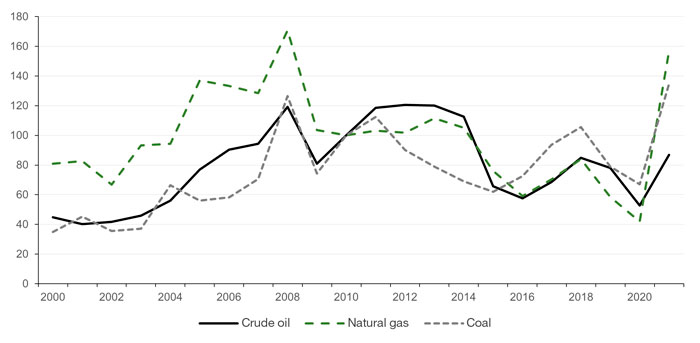
Source: Economic Commission for Latin America and the Caribbean (ECLAC), on the basis of World Bank, “World Bank Commodities Price Data (The Pink Sheet)” [online] https://www.worldbank.org/en/research/commodity-markets.
Notes: The oil price index was calculated considering the simple average of Brent, Dubai and West Texas Intermediate spot prices. The natural gas price index was calculated considering the simple average of European and U.S. spot prices (Henry Hub natural gas). The coal price index was calculated considering the simple average of the Australian and South African spot prices.
In view of these developments, the question arises as to whether we are facing a new price supercycle. The last one started in the mid-1990s and lasted until 2015–2016 (Acquatella, Bello and Berrios, 2019). The COVID-19 crisis led to a new price floor in 2020.
Other factors have been added to the price equation that make it difficult to foresee whether a new supercycle will occur. In addition to the inelastic supply in the short term, conditioned by long-term gestation periods, the role of OPEC as the main producing block, and the geopolitical struggle between the great powers, which are the largest consumers, China is now better positioned in global trade and the world economy than at the beginning of the century and is clearly disputing the hegemony of the United States, which is playing a new role as a net exporter of certain hydrocarbons. Added to this power struggle with long-term prospects, is the conflict between the Russian Federation and Ukraine, where the roles of these powers with regard to possible resolutions (assistance and sanctions) will be decisive in the short run in terms of alleviating or aggravating pressure on the hydrocarbon markets.
Finally, reference bodies in the energy sector, including the International Energy Agency (IEA, 2021), recognize and project scenarios of zero net emissions in 2050 as a result of an energy transition. The latter responds to global agendas for sustainable development and climate change that aim to develop cleaner, renewable and inclusive energy systems to reduce greenhouse gas (GHG) emissions, pollution, and access and affordability gaps.
The factor generating greater long-term uncertainty in the hydrocarbons markets and, therefore, price cyclicality, is investment in the sector itself, as opposed to the prospects for investment in low-carbon, clean and renewable energies to meet the world's growing energy demand. This is a warning for hydrocarbon-producing countries in the region, especially for those that are net exporters and where this activity accounts for a significant share in the generation of foreign exchange and tax revenues. Such countries should review and adjust their energy plans for a progressive transition to clean and renewable energies in order to reduce the risks of energy insecurity, fossil-fuel dependence, stranded assets, foregone tax revenues from fuel subsidies, as well as those associated with socioenvironmental and health conflicts.
In such a scenario, hydrocarbon-producing countries in the region may need to meet differentiated goals amid emerging global schemes, such as carbon taxes or prices, as well as technical and financial assistance, given the significant amount of fossil reserves that they have for supplying energy to their industries and homes, but which they would cease to exploit in order to achieve the goals of the aforementioned agendas.
In this context, the planning and coordination of energy and industrial policies, with an adequate institutional framework, transparency and long-term vision, will be key. However, this reflection leads to another question: can State-owned hydrocarbon enterprises become energy companies, for example, through strategic partnerships, in order to diversify both assets and energy sources (towards clean and renewable energies) and achieve sustainable energy security? To respond, a comprehensive and participatory government agenda that brings together public, private and civil society actors is needed.
In sum, although in the short term the outlook for hydrocarbon and mineral prices to remain high is positive, their prospective performance is framed within a context of great uncertainty and volatility. In the medium and long term, the behavior of these prices will depend to a large extent on the degree of progress in the energy transition towards renewable and sustainable energy sources.
B. Agricultural prices reach record highs
Agricultural commodity prices rose almost 30% between July 2020 and the same month in 2021 as demand for food outpaced the supply-side recovery. Against a backdrop of historically high prices, in early 2022, the conflict between the Russian Federation and Ukraine dealt another blow on the supply side, both for energy and for grains and fertilizers, with food prices reaching their highest levels in a decade in February 2022.
For countries, companies and households producing such products, high prices are a relief after five years (2015–2020) of low but stable prices (see figure 3). However, this situation will be mitigated by the increase in costs due to higher fertilizer and energy prices. At the same time, high prices also have an impact on the consumer side in the form of food price inflation. The combination of higher prices and declining incomes, especially in poorer households, may force an uncomfortable choice between quality and quantity of calories on those quintiles of the population already suffering from undernourishment or malnutrition. The specific impacts of this new price increase vary according to the level of analysis (subregion, country, territory, household) and perspective (producer or consumer).
Figure 3
Price indices of main agricultural commodity groups, 2015–2022
(Nominal dollars; index: 2010 = 100)
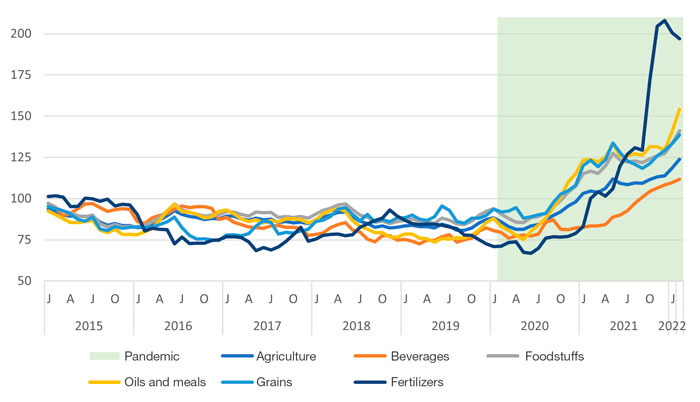
Source: Economic Commission for Latin America and the Caribbean (ECLAC), on the basis of World Bank, “World Bank Commodities Price Data (The Pink Sheet)” [online] https://www.worldbank.org/en/research/commodity-markets.
1. Agricultural products and fertilizers react to recovery
At the beginning of the pandemic, the agricultural price index recorded a 12-month low of -2.1% (April 2019 – April 2020). The great uncertainty about global aggregate demand generated a dramatic decline in all commodity groups (e.g., energy fell 65.1% in 12 months in April). The smaller drop in agricultural commodity prices was evidence of the resilience of demand for agricultural products during the pandemic.
From mid-2020 to mid-2021, agricultural commodity prices recorded a strong, steady rise, with annual growth of 30% (see Figure 4). In December 2021, agricultural prices were 31% higher than their pre-pandemic (2017–2019) average (see figure 5). The growth in the prices of grains (37%) and oils and meals (55%) were particularly noteworthy. Some staples in the region's agricultural output have been key to the generalized increase. Arabica coffee reached a 10-year high at the end of 2021, 94% higher than its average in 2017–2019. Soybeans and their by-products rose 44% (beans) and 76% (oil). Maize rose to a high of 87% above its 2017–2019 average, to be up 62% by the end of 2021. Prices of perishable commodities experienced less volatility during the pandemic: fruits and vegetables fell slightly at the outset, but during 2021 stabilized above their levels in 2017–2019. Meat showed significant increases in 2021: beef rose 34%, and chicken 29%,
Figure 4
Latin America and the Caribbean:* year-on-year rates of variation in the consumer price index (CPI) and CPI-Food and beverages (HICP), weighted average, January 2019 – November 2021
(Percentages)
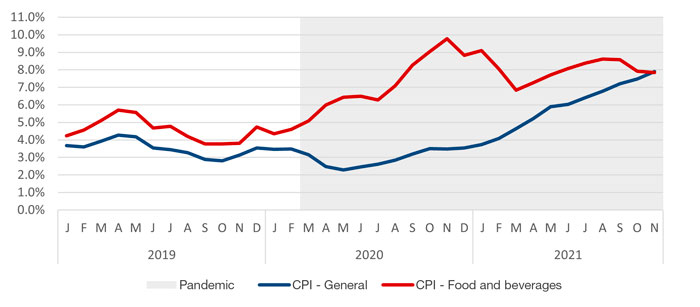
Source: Economic Commission for Latin America and the Caribbean (ECLAC), on the basis of CEPALSTAT database https://statistics.cepal.org/portal/cepalstat/index.html?lang=es.
*Includes 12 countries (Bolivia (Plurinational State of), Brazil, Chile, Colombia, Costa Rica, Ecuador, Guatemala, Honduras, Paraguay, Peru, Uruguay, and Mexico) with data available to November 2021.
Figure 5
Prices of selected commodities and their performance in the pandemic
(Nominal dollars; index: 2017–2019 average= 100)
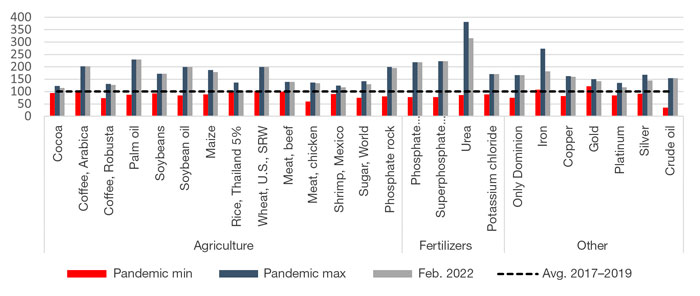
Source: Economic Commission for Latin America and the Caribbean (ECLAC), on the basis of World Bank, “World Bank Commodities Price Data (The Pink Sheet)” [online] https://www.worldbank.org/en/research/commodity-markets.
Fertilizers are a key input for much of the region's agriculture and an important component of production costs. Their prices are traditionally volatile and experienced a historic increase at the end of 2021: the fertilizer price index rose to its highest level in 13 years, up 162% over the pre-pandemic average (2017–2019) (World Bank, 2021b). Fertilizer supply remains under pressure from the conflict in Ukraine, and some countries (such as the Russian Federation) have restricted fertilizer exports in the face of geopolitical uncertainty. In February 2022, the Russian Federation announced a ban on ammonium nitrate exports, a major blow to regional agricultural productivity, and to Brazil, its most important partner in that area.
Nitrogen-supplying urea was behind much of the upside in 2021, reaching a price of US$ 900 per metric ton in November that year, an increase of 381.2% from its pre-pandemic (2017–2019) average (see figure 5). Phosphates, such as diammonium phosphate (DAP) and triple superphosphate (TSP), saw increases of over 200% in the same period. Urea is one of the most important fertilizers for regional agriculture: agricultural use of urea in the region exceeded 2.7 million tons in 2019, with regional imports of urea amounting to nearly US$ 3 billion that year (FAO, 2021). High fertilizer prices have a negative impact on the profit margins of regional agricultural producers, but at the same time generate incentives for a gradual transition towards an agriculture that is more ecological and sustainable, and makes greater use of bio-based inputs.
2. Demand recovery and supply constraints behind the upswing
Movements in international agricultural commodity prices reflected factors that limited supply and increased demand. The supply of agricultural products depends largely on weather conditions in the top-producing countries for each crop (e.g., Thailand for rice); Argentina, Brazil and the United States for soybean; Brazil for coffee). Demand depends to a large extent on economic conditions in the leading consumers of each crop (e.g., China for soybeans, Europe and the United States for coffee). In mid-2020, global consumption experienced short periods of buoyancy, combined with fiscal stimulus that had a strong positive impact on household incomes, which resulted in rising demand and recovery in a variety of economic sectors. On the other hand, the corresponding increase in oil prices (from historically low levels) increased transportation costs worldwide. Supply logistics also suffered bottlenecks, limiting deliveries and further increasing transportation costs. The combination of demand and supply factors caused a sharp rise in international agricultural commodity prices.
The conditions underlying the price increases over the last 18 months have been extraordinary and are not necessarily persistent. After a year of economic recovery in 2021, overall growth in the countries of the region is expected to be less dynamic. However, there are factors, such as the risk of geopolitical instability due to the conflict in Ukraine, which have already renewed concerns regarding the global supply of fertilizer, oil and grains.
3. The implications depend on each country's trade profile and poverty levels
High prices have a positive impact on the region's terms of trade but can create problems for Caribbean countries. Latin America and the Caribbean is a net exporter of agricultural products, with exports exceeding imports by 2.6 times in 2020. However, a subregional comparison reveals big disparities. South America's agricultural exports are four times higher than its imports (by value), while the Caribbean countries are net food importers (FAO, 2021).
One of the most significant impacts of high agricultural commodity prices can be seen in local food prices in a context of increasing poverty, which encompassed 86 million people in the region in 2021 (ECLAC, 2022). In real terms, food prices (according to the FAO index) recorded strong rises throughout 2021 and in November reached their highest level since 1990, led by price increases in the oils, sugars and cereals categories (FAO, 2022). High agricultural commodity prices are reflected in higher local prices depending on the degree to which countries depend on imports and their connectivity to international markets. In particular, Caribbean countries are vulnerable to a protracted period of high agricultural commodity prices, as they are more dependent on grain and cereal imports.
The rise in commodity prices coincided with a global inflationary context. Food prices were the first to rise at the regional level. Many countries in the region and worldwide reported record high levels of food inflation. In November 2020, it reached 9.8% per year (weighted average of 12 countries in the region), compared to an annual increase of 3.5% in the CPI overall (see figure 4). However, by the end of 2021, significant rises in the overall CPI closed the gap. For example, in Mexico, food, beverages and tobacco inflation was 10.7% year on year in December 2021, its highest level in more than 20 years, compared to a 7.4% rise in the general index over the same period.
Regional emergency measures in response to the onset of the pandemic included lines of action to minimize the incidence of hunger in the region. Some are still in effect today and are necessary in the current context of inflationary pressure (ECLAC/FAO, 2020). A new wave of price rises due to the conflict in Ukraine poses a threat to food security in the region, particularly in the Caribbean, where there is high dependence on imported grains.
III. Bibliography
Acquatella, J., O. Bello and F. Berrios (2019), “Evidencia estadística de superciclos en las series de precios de los metales y el petróleo, 1990-2015”. En: R. Sánchez R. (ed.), La bonanza de los recursos naturales para el desarrollo: dilemas de gobernanza, R. Sánchez R. (ed.), ECLAC Books, No. 157, Santiago.
Boer, L. and others (2021), “IMF: Soaring metal prices may delay energy transition”, Balkan Green Energy News.
ECLAC (Economic Commission for Latin America and the Caribbean) (2022), Social Panorama of Latin America, 2021 (LC/PUB.2021/17-P), Santiago.
_(2021), International Trade Outlook for Latin America and the Caribbean, 2021. Summary (LC/PUB.2021/14-P/Rev.1), Santiago.
ECLAC/FAO (Economic Commission for Latin America and the Caribbean/Food and Agriculture Organization of the United Nations) (2020), “Preventing the COVID-19 crisis from becoming a food crisis: urgent measures against hunger in Latin America and the Caribbean”, COVID-19 Report. ECLAC-FAO, Santiago.
Chian, K. W. and J. Baffes (2021), “Sustained rebound in metal prices amid the global economic recovery”, Data Blogs World Bank.
FAO (Food and Agriculture Organization of the United Nations) (2022), FAO Food Price Index [online] https://www.fao.org/worldfoodsituation/foodpricesindex/es/.
_(2021), Food and agriculture data (FAOSTAT) [online] http://www.fao.org/faostat/es/#home.
IEA (International Energy Agency) (2021), “Net Zero by 2050: A Roadmap for the global energy sector”, IEA Paris.
Jones, B. F. Acuña and V. Rodríguez (2021), "Cambios en la demanda de minerales: análisis de los mercados del cobre y el litio, y sus implicaciones para los países de la región andina”, Project Documents (LC/TS.2021/89), Santiago.
World Bank (2021a), World Bank Commodity Price Data (The Pink Sheet) [online database] https://www.worldbank.org/en/research/commodity-markets.
_(2021b), “Commodity markets outlook: urbanization and commodity demand”, Washington, D.C.