Speech
Slow worldwide rise by 0,16% & fall of 2,9% in Latin America
Traffic fall in Latin America
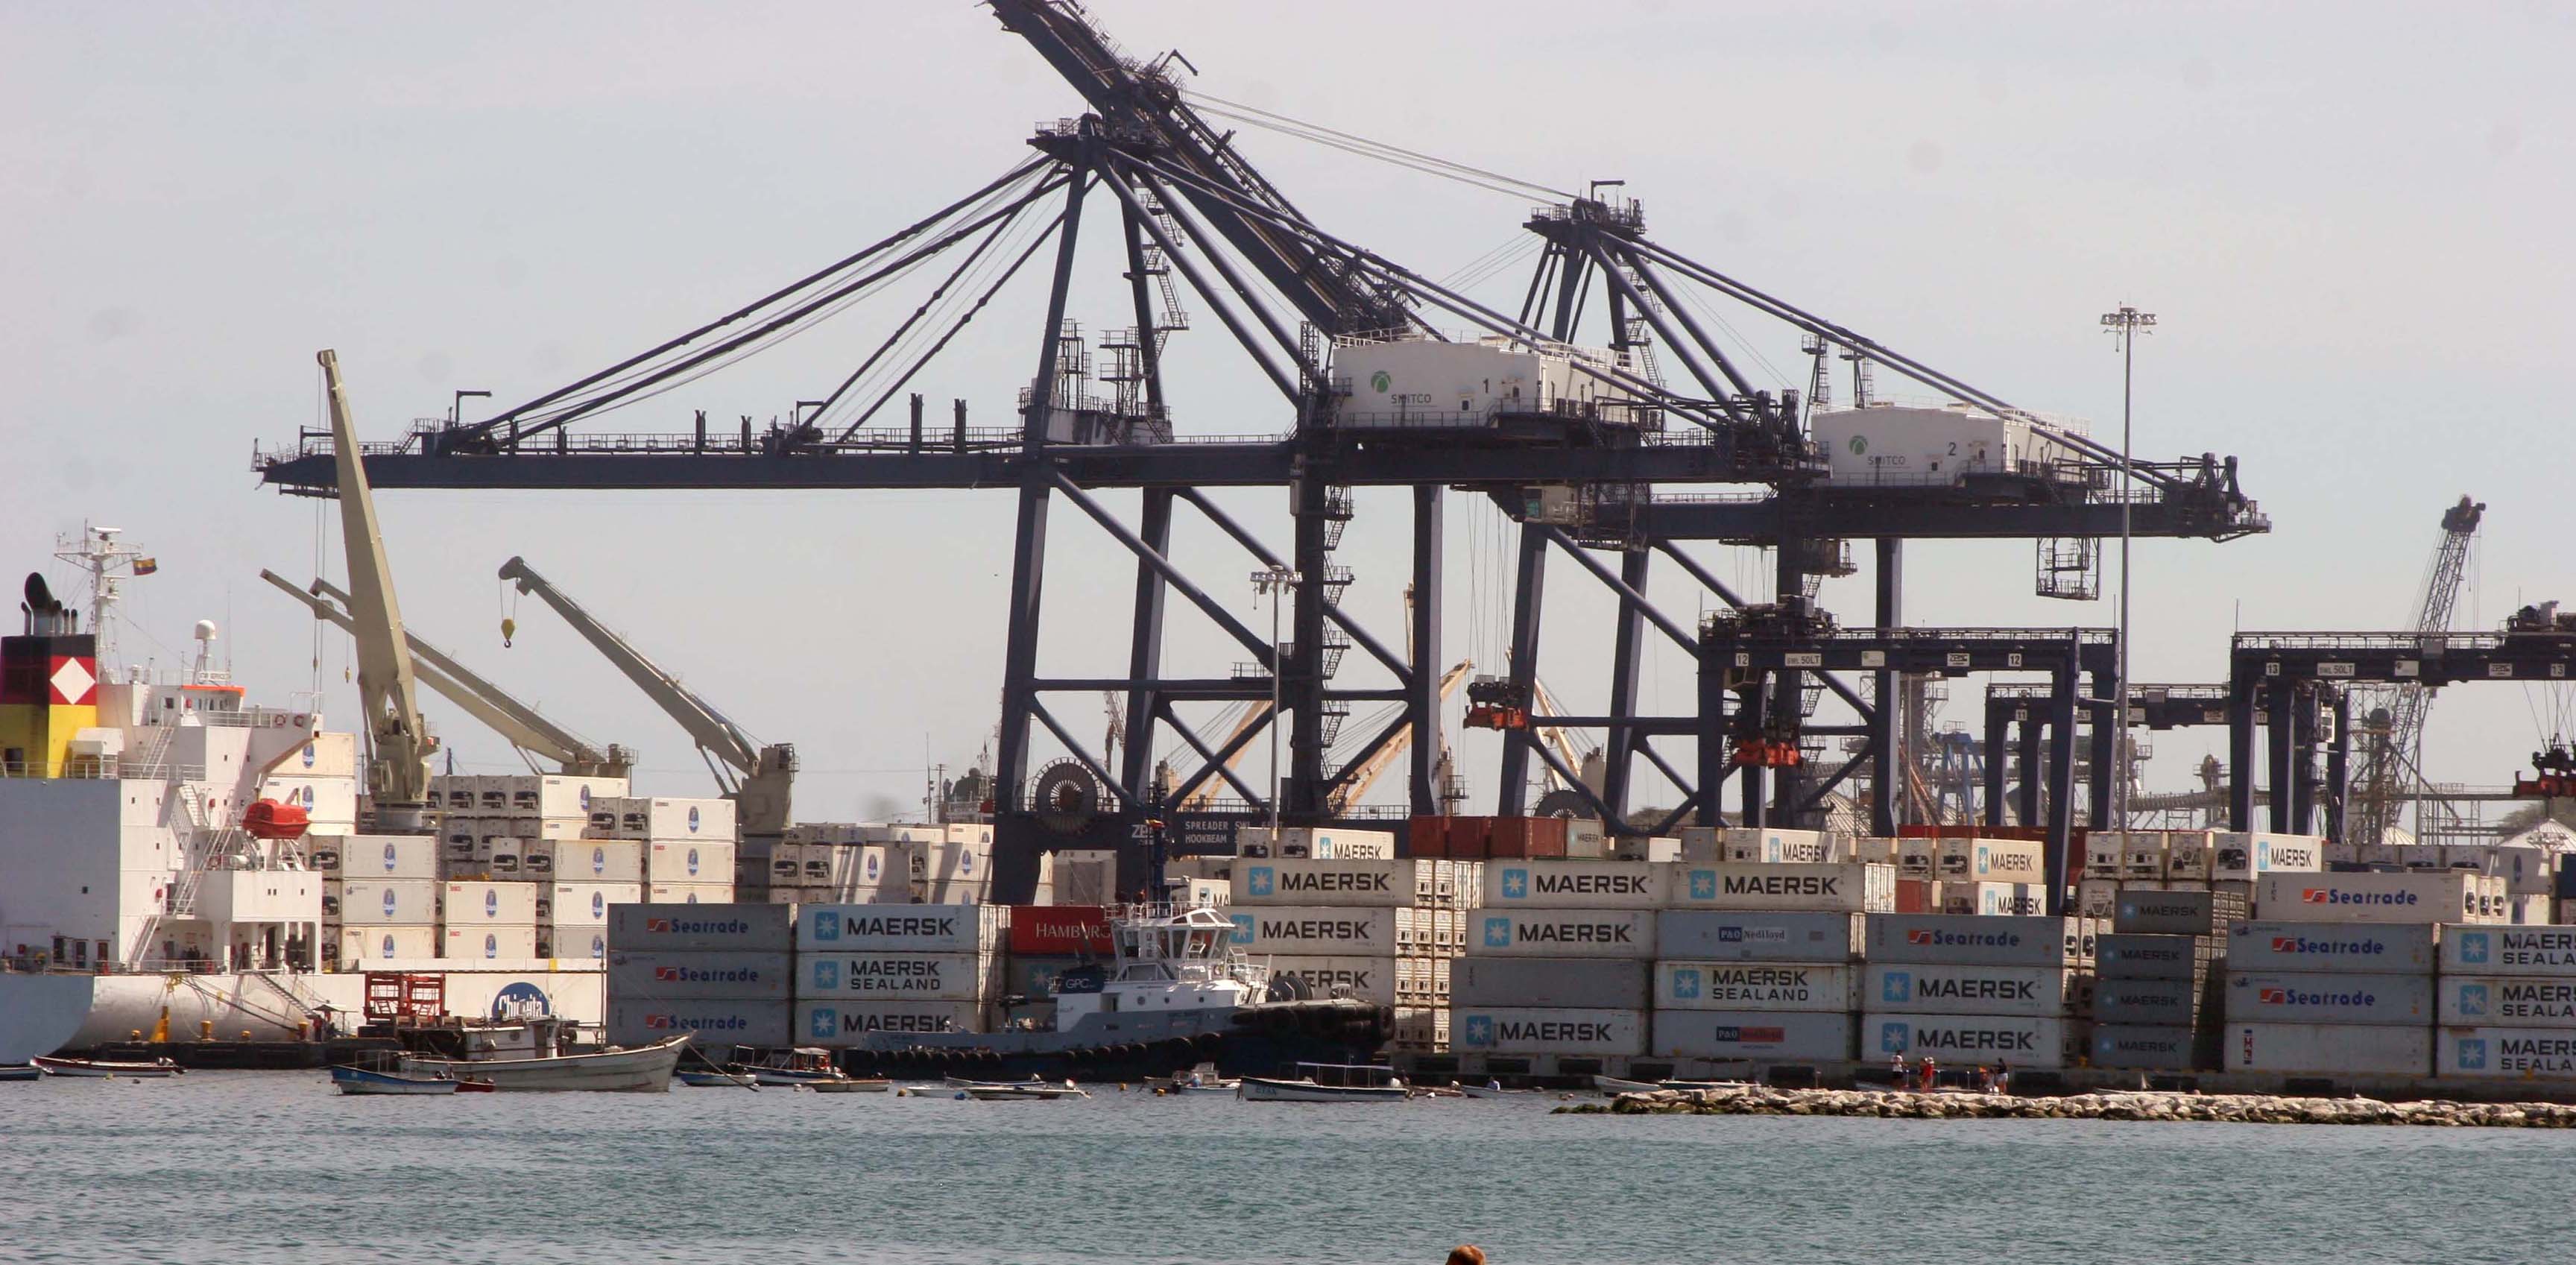
The throughput of containerized cargo at ports in Latin America and the Caribbean felt by 2,9% during the first half of 2016 (PS_2016). Compiled numbers reveal a deepening trend down for container ports by ECLAC in previous years (Maritime & Logistics Bulletin 56, 66). This is the result of a slowdown in foreign trade, mainly reflected in a fall in activity in terminal container in some countries of the region and a loss of market, competition from other routes, in some major transshipment ports in Panama and Colombia. The fall of the port container throughput sharpens slowdown that was already showing this activity in the past two years, with weak growth rates in 2014 (0.8%) and in 2015 (1.7%). The total volume of activity in the PS_2016 reaches an approximate estimated 23 million TEUs[1].
In the PS_2016, 13 of the 30 most important ports of containers of Latin America and the Caribbean (6 among the top 10) recorded declines in traffic, with decreases in the major subregions (Panama and Colombia, Mexico, East Coast of South America). The data collected show that the total volume of traffic in these first 30 ports - more than 80% of regional container port traffic - decreased by 3.7% in the first 6 months of 2016. The low dynamism of PS_2016 was mainly determined by the significant falls in activity in four countries, which in total are responsible for 53% of container traffic in Latin America: Panama (-12,8%), Colombia (-11,1%), Brazil (-3,9%) y Argentina (-5,1%). These groups of countries show a decline of 8.1% compared to the first half of 2015. In the port areas of Colon and Balboa (both in Panama) container traffic felt in the PS_2016, by 16% and 9% respectively. In Santos (Brazil) - including TUP Embraport - this traffic remarkably felt by 13%, while Cartagena (Colombia), Manzanillo (Mexico) and Buenos Aires (Argentina) ports records fall of 15%, 4% and 5% respectively according to figures recently published by the national port authorities.
The data collected indicates a great heterogeneity in the behavior of port movements, in subregional and country. From the information collected in 70 ports in Latin America and the Caribbean, the results for the PS_2016 by major subregions ranged from a growth of 5% for all ports in Central America (excluding Panama and Belize) to a slight fall of 0.5% in Mexico, and a decline of 9.9% in the subregion regarding transshipment (Panama + Caribbean). East Coast of South America shows a drop of 4.1% and the West Coast of South America grew by 4.8%.
From the country perspective, six in the region showed sharp declines: El Salvador (-15.4%), Panama (-12.8%), Colombia (-11.1%), Argentina (-5.1%), Brazil (-3.9%) and Mexico (-0.5%). In contrast, six countries in the region showed a significant increase in container port: Nicaragua (21.9%), Dominican Republic (9.4%), Guatemala (7.2%), Costa Rica (5.9 %), Ecuador (5.5%) and Uruguay (4.9%). Three countries register a growth more moderate: Chile (3.8%), Peru (2.3%) and Honduras (2.0%). See Table 1 Port Container movement by country in Latin America and the Caribbean, first semester 2016. The next four ports recorded double-digit increases: Santo Tomas de Castilla (15.7%), Guayaquil (14.5%), San Antonio (12.8%) and Lazaro Cardenas (10.0%). See Figure 1. Variation of port container movement in Latin America and the Caribbean. See Figure 2. Port Container movement by selected ports in Latin America and the Caribbean, first half 2016.
A weak global growth
According to Alphaliner estimates, the total container movement in the top 30 ports in the world was sluggish in the PS_2016, with an aggregate growth of only 0.16%, and showing increased activity weak in most regions of the world. The top 30 ports account for more than half of all containers globally, with an aggregate volume reaching 184.57 million TEUs during the PS_2016, compared with 184.28 million TEUs in the same period of 2015. The same source says the global movement of containers in ports should grow by only 0.3% this year from what was observed in the first half of the year.
Regarding the first 30 ports, 12 recorded reductions in volume, including 6 ports of the top 10. Among the main losers are Hong Kong (- 10.5%), Dubai (-6.1%), Singapore (-5, 1%), Tanjung Pelepas (-2.8%) and Rotterdam (-2.3%). The container port busiest in the world, Shanghai, also recorded a decrease (-0.8%) to reach 17.89 million TEUs in the PS_2016, compared with 18.03 million TEUs last year. Among those who grew the most: Algeciras in Spain with an increase of 13.1%, followed by Malaysia Port Kelang (12.3%) and Colombo in Sri Lanka (11.2%).
[1] TEU is the standard unit of measurement equivalent to a container of 20 feet or 6.25 meters,
ie: a metal box of standard size that can be easily transferred between different forms of transportation such as ships, trains and trucks.


